Plotting a Point in Cartesian Plane is very easy if you know how to draw a cartesian plane in a coordinate geometry graph. A cartesian graph is an intersection of two points at O. They are represented by two numbers in parentheses, separated by a comma that is called coordinates. Learn more about the cartesian plane from here and know how to draw a cartesian plane and then plot points on the cartesian graph. Scroll down this page to learn plotting points on a cartesian plane with solved examples.
Read Articles:
- Worksheet on Plotting Points in the Coordinate Plane
- Quadrants and Convention for Signs of Coordinates
What is Cartesian Plane?
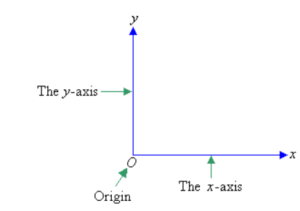
The cartesian plane is a representation of the position of a point by referring to it in terms of x-axis horizontal line and y-axis vertical line respectively. The point of intersection of x-axes and y-axes is known as the origin. The origin is represented by the letter ‘O’. The coordinates have two values the first number represents the x-coordinate and the second number represents the y-coordinate.
How to Plot Points in Cartesian Plan?
- First, check the signs of the coordinates of a point and then identify the quadrant in which the point is to be plotted.
- Take the rectangular cartesian frames XOX’ and YOY’ intersecting at the right angles at origin ‘O’.
- Take a point P on the x-axis on the side of the involved quadrant such that the distance of the point P from the origin O equals the value of the x-coordinate.
- Draw a perpendicular line PQ on the x-axis. Take a point M on this perpendicular such that PM is equal to the value of the y-coordinate and M in the relevant quadrant. Thus the point M is plotted as per the given coordinate points.
Plotting a Point in Cartesian Plane Examples
Plot the following points in the cartesian plane then identify which quadrant or axis it belongs
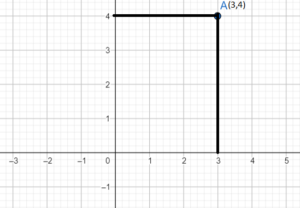
Example 1.
Plot the points (3,4) in the Cartesian plane.
Solution:
Given that the points are (3,4)
Here the x-coordinate is 3 and the y-coordinate is 4.
(3, 4) is a point in the first quadrant because both the coordinates are positive.
Now plot the graph using the coordinates (3,4)
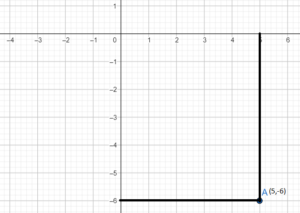
Example 2.
Plot the points (5,-6) in the Cartesian plane.
Solution:
Given that the points are (5,-6)
Here the x-coordinate is 5 and the y-coordinate is -6.
(5, -6) is a point in the fourth quadrant because both the coordinates are positive.
Now plot the graph using the coordinates (5,-6)
Example 3.
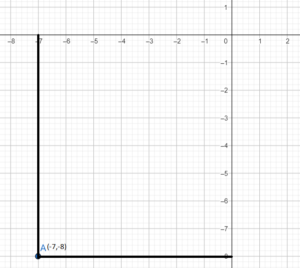
Plot the points (-7,-8) in the Cartesian plane.
Solution:
Given that the points are (-7,-8)
Here the x-coordinate is -7 and the y-coordinate is -8.
(-7, -8) is a point in the third quadrant because both the coordinates are positive.
Now plot the graph using the coordinates (-7,-8)
Example 4.
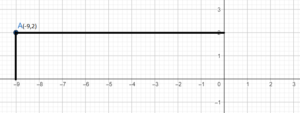
Plot the points (-9,2) in the Cartesian plane.
Solution:
Given that the points are (-9,2)
Here the x-coordinate is -9 and the y-coordinate is 2.
(-9, 2) is a point in the second quadrant because both the coordinates are positive.
Now plot the graph using the coordinates (-9,2)
Example 5.
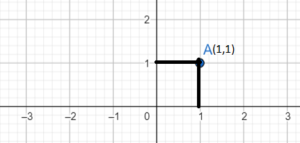
Plot the points (1,1) in the Cartesian plane.
Solution:
Given that the points are (1,1)
Here the x-coordinate is 1 and the y-coordinate is 1.
(1, 1) is a point in the first quadrant because both the coordinates are positive.
Now plot the graph using the coordinates (1,1).